Exploring options to big tech has led me to different services that mirror what Google, MS, or Apple provide in terms of document suites, browsers, search, email clients, and now email providers. So far, I’ve started using:
Vivaldi Bowser & Email client
Qwant Search
Brave Bowser & Search
DuckDuckGo Browser & Search
CryptPad Open Source Document Suite.
Pronton Office Suite, including proton.me email.
Over the past month, I’ve been using Vivaldi heavily. I’ll go to the old browser to move PWs over, or look up something in my history, but I am largely just using Vivaldi for my browser and email client(I also have to use Chrome to access some Google features.) It is not a reluctant acceptance of something lesser because I want to move away from Google and the others. I’ve found that I have a genuine preference for Vivaldi in all aspects of my use.
While I started with CryptPad as an alternative, I am also using Proton more and more. CryptPad has some shortcomings that will likely make me move completely to Proton. Chief among them is the lack of functional spell check. I am a horrible speller, so spell check is necessary for me.
Next on the list is an email provider. Google and iCloud are clearly dependable and Google provides access to it’s documents and spreadsheet apps. But, they also collect our data, use it to sell ads, and generally make it clear that we are a commodity.
Proton looks like a very viable alternative. It has the office doc function of Google Business Suites (GBS) as well as email. I’ve been using it over the past few weeks, and I like the tool so far. Honestly, I have to remember to go to it rather than GBS since Google has done a good job of integrating everything… every click seems to lead to a google function or tool. But, given a bit of time, the habits will be developed and using Proton will become more natural.
How I got to Proton.me
This next part is just principle, not practical. In the US, the government has demonstrated a willingness to collect our data. From confiscating phones to video facial identification, to contracting with data brokers, we are a heavily surveilled citizenry. Given the ease with which tech giants in the U.S. cave to the government (wasn’t always this way), I’d rather minimize my dependency on these companies. So, having services like email (along with documents) encrypted end to end is appealing to me.
When looking for an email provider, I have the following criteria:
1) Security and privacy are a top priority
2) Reliable, on-going dependability
3) Browser-based and mobile app email clients
4) Ability to access and manage other email accounts
Since US-base tech companies seem to be more concerned with profit and government action than the privacy of the users, I’d also like to avoid US-base email providers.
With this in mind, I’ve landed on Proton.me. This is a Swiss-based company that prioritizes privacy and security. Being in Switzerland, there is a culture of privacy that is globally renown.
All email is encrypted. The server has nothing on it that authorities can access, and it is not subject to U.S. jurisdiction.
Proton.me also has all the other features I am looking for.
Like the other privacy-centric, encrypted services, there is a greater responsibility for the user to keep track of the access credentials. If you lose the login and the backup phrase, You’re out of luck.
A bonus of the Proton.me service is that it includes the equivalent of Google Business Suite. I am testing this and will compare it to CryptPad. But, early use indicates it may be what I am looking for.
Tech Inertia is a Bitch
It is too easy to simply click and accept what the big tech companies feed us. They do make it easy, which seems like a positive. And in may respects, it is. But there is a price.
The fact that you have to spend a fair bit of time to find alternatives is an indication of how much we’ve acquiesced. In a country that claims we thrive on competition, we’ve pretty much eliminated domestic competitors in the tech space. There are a few giants and they’ve carved up the tech eco system. In any one segment, you have one dominant player, and perhaps one or two token competitors.
The “click and accept” is technically about the terms of service. But, it goes much deeper. We are accepting a company that leverages and sells our personal information, gives into government intrusions, supports politicians who go against our interests, and generally champions business strategies (big data centers, deregulation, litigation/legal manipulations), that ultimate work against individuals.
Inertia keeps us on this path. Only through effort can we mitigate the tech giants that control the landscape. Look for alternatives; find email providers other than gmail or yahoo, or outlook; look for different office doc services; buy direct from companies – or even (OMG) buy off-line.
My journey to minimize by use of big tech tools, find alternatives or just do without, elevated the question, “what about office documents; Doc writing, spreadsheets, slides, etc?” I’ve been hooked on Google Office for well over a decade, mostly because its free. But, are there options that provide similar capabilities and a reasonable cost… or even free?
These alternatives range from free (Open Source – community supported), freemium, and premium options. I focused on the free options.
What is interesting to me is that, because these are Open Source, a foundation of capabilities is available to whoever wants to build with it. Similar to how Chromium is the foundation of Chrome, as well as Brave, and DuckDuckGo browsers. In the case of Office Applications, I jumped into CryptPad, a France-based initiative.
How did I land on Cryptpad Collaborative Office Suite?
I had some criteria:
Security & Privacy. Up to this point, I accepted the Google will access all my docs, gather data about me and use this as part of the mega data profile it builds on all users and sells. But why should I just accept that? Oh, yeah… inertia.
Browser-based access and usage. I didn’t want to download an app (we used to call these ‘programs’). It has to function 100% in a browser.
Cloud storage. I don’t need much, but being able to store the documents and access from anywhere is important to me.
Decent user interface. I am not looking for a Google Business Suite clone. But, it has to be easy to navigate and at least somewhat intuitive.
Ability to share/collaborate.
Cryptpad Office Collaboration Suite has all of the above. It is not perfect, but then neither is Google. Also, because it is open source, you can go direct or use other organizations that implement CryptPad. I started with U.S. based https://unredacted.org. Then I switched to cryptpad.fr.
Office App Security & Privacy
As the name of the suite indicates, CryptPad is end-to-end encrypted. Wherever you decided to join, the data stored in the server – your documents – is encrypted. The host cannot read your documents. Your data is yours.
Like other online apps, your access is granted via user name and password. What is different is that CryptPad does NOT collect other information from you. No email, no phone number, no birth date, not even your name. Since they are not using the app to gather personal information for marketing or to sell like other organizations, they simply don’t collect it.
With Personally Identifiable Information (PII) being hacked across websites and platforms, CryptPad can’t be targeted in this way. Even if a hacker managed to breach the server, there is nothing to tell them who the users are or even be used to connect them to other data sources.
The downside? If you lose your user name or password, you’re screwed. There is no account recovery mechanism to which you can have a text or an email sent. CryptPad is very clear about this when you set up an account. It is the ultimate in personal accountability. A bit like a Swiss bank account only accessible if you have the number. Lose the number and lose the content.
Storage Space
The free version of Cryptpad provide one GB of online storage. Online docs don’t take much space, so for me 1GB is fine. You can also subscribe for more space of needed.
A feature I appreciate: When you create a new document, you can set trash-date. If you want, the document can be deleted automatically after 1, 2, 3 or more months. For me it is not so much a space issue as an organization issue. I work through ideas by writing and can pile up a lot of documents that are just working through a topic, or figuring out how i want to word something. I don’t need these; but I don’t actively delete them either. So, I tend to have a lot of junk. This auto-trash feature is perfect for a wondering mind.
Connecting with others
Connecting to other users is done by sending them your profile link, or getting thier profile link. Once you have it, you can send or accept a profile connection request. When both users agree to a connection, file can be share directly without using a share link.
File sharing with non-CryptPad users
You can use a share link to give someone else read or edit access. A neat feature is that you can provide a “view once.” If you want to get some feedback but not actually do a full collaboration.
By connecting with other people using CryptPad, you can share documents with their profile.
There are some known bugs in CryptPad. One us that spellcheck is does not always function. Fortunately, with the Rich Text Editor, the browsers built-in spell check will highlight spelling issues.
Our information is currency. It is used by large tech firms to monetize our activity, feed us a never-ending stream of influences, and create time-sucks that they can further use for monetization. Moving away from some of the big-tech solutions helps us mitigate the influence these companies have. So, where we can, we should find and support alternatives.
As the push for a tax system that reintroduces higher taxes on the very rich gains steam, there are those who push for more taxes on the lower 40% of income earners. They will say that the bottom 40% pay no taxes.
To be clear, the lower 40% pay Payroll taxes. They pay Social Security and Medicare taxes. These are levied on all income earners. Ironically, those making over $168k don’t pay SS taxes on income over that amount. When we say they don’t pay taxes, what we are specifically talking about is the Income tax.
Also note, that “lower 40%” is not exactly accurate, but we’ll leave that alone for this conversation.
Why do the “lower 40%” not Income Tax?
The Cost of Living
Before we dive into the mechanisms of the tax system that make this possible, lets first touch on the range of cost of living. This is important because it informs the polcies behind the tax code. The source for the COL is from MIT and can be found at https://livingwage.mit.edu.
Obviously, the COL varies significantly across the country.
In Mississipy or Tennessee the pre-tax cost of living is in the low $40k range for a single person. That cost grows to $70k with a child. Two adults, the cost is about $60k in Tennessee, and similar in other lower income states.
In Chicago or New York City, its $55K and $89k for a single person, nearly double with a child.
Keep in mind that these lower level wages are only to pay the basic bills. No savings. No paying debt.
Understanding the cost of living is important to the “pay no taxes” conversation because it is used to inform tax policy.
How are people in the lower 40% not paying income taxes?
The practicle answer is simple, the Standard Deduction is higher than the person or household earned. It is set to about $15k for individuals, $24k for head of household, and $32k for married couples. In addition, there are credit provided for children, vets, or elderly. The standard deductions are higher than the amount that people are earning.
We all receive this benefit. Thats why its the standard deduction. Some people may earn enough and have high enough property taxes, charitable contributions, or other deductions that sum to more than the standard deduction. The rest of us are basically given a pass on the first $15k to $32k of our income and pay no taxes on that first chunk.
The real Implications of this issue
Nearly 40% of our fellow citizens don’t pay income taxes – it is an indictment of our society’s distribution of wealth and wages.
In the lowest cost of living states, the income needed to just survive is over $40k. The lower 40% are earning so little in our country that the Federal Government acknowledges that they don’t earn enough to afford taxes. With the standard deductions, and people not paying income taxes, people are earning much less than the the COL needed even for the most affordable states.
The lower income for so many U.S. citizens is the direct result of the rich and corporation shifting the GDP from the workers to profit and capital. Since the revenue from the GDP is being disproportionately funneled to the rich, it makes sense that the rich should be taxed to recover the revenue that isn’t available from the average wage earners.
When Google and Apple caved on the Lake Ontario naming for maps, I moved to MapQuest. I know this will not make a bit of difference to the big tech firms. But, it’s a personal response to the sycophantic march of big business to a leader for whom I have no respect.
As I opened MapQuest and played with it a bit, I realized it was just as good as the others. I particularly liked the ease with which you could toggle between alternative routes. And this got me thinking…
Inertia’s a bitch.
Over the past decade+ I simply adopted the next release or product from big tech. From browsers, to search engines, to doc editors and spreadsheets, I just started using what Google or Apple released. So, I decided to see what others had to offer, starting with browsers, search engines, and online office docs.
Browsers. I’ve used Firefox in the past. It was fine. A few I tried for the first time over the past few weeks are Brave, DuckDuckGo, and Vivaldi. What I realized is that all of these put privacy first. From built in ad blocking to easy access VPNs (premium service), protecting yourself was made easier by these browsers.
From an interface perspective, Brave is a Chrome mimic – it’s foundation is Chromium (an open source project) – the same as Chrome, but with much better privacy built in. It provides metrics on blocked ads and trackers as well as time and bandwidth saved by not letting these things load into the browser. Out of the box, Brave default graphics are nicer than Chrome, IMO. Brave does make money on advertising. But, the users aren’t tracked the way Google tracks users.
DuckDuckGo is another Chromium-based browser. Its UI is plain, similar to Chrome. Privacy, blocking your information from websites, blocking email tracking, and a host of other privacy tools come enabled out of the box. Many aren’t even offered with other browsers. Like Brave, DuckDuckGo makes money through ad partnerships (non-tracked), and premium services.
From a privacy protection perspective, Brave and DuckDuckGo are similar, with DDG just ahead.
My Favorite Browser
Vivaldi... hands down my favorite browser. It has built-in privacy protections and easy access to a VPN. It is more complex in appearance, yet intuitive for me. This may not be how everyone’s mind works, but the browser uses both sides and the top as functional areas. In addition, the built-in email client was a breeze to connect to multiple email accounts and easy to navigate between them.
After seeing how similar two of these are to Chrome, and how much more I like one of them, I see no reason to keep using Chrome. This is especially so when I factor in the privacy protections that come standard with the alternatives.
The reality of capitalism, whatever its strengths, is that it can be brutal on individuals. Our history is marred by mistreatment, exploitation, and abuse by companies against their workers and communities. These abuses are as well-documented as they are disturbing.
Early last century, companies writ large discharged workers when they became too old to continue working, after years of paying wages that were barely adequate for daily expenses. It was not a question of employees being disciplined and saving for retirement; they simply weren’t paid enough to be able to save. Old age or poor health often meant poverty so acute that suffering was assured, and the end of life soon followed.
The Answer: Social Safety Nets in The New Deal
During the 1920s and 1930s, the voices of the people were being heard in Washington, D.C. The efforts resulted in the New Deal and included the creation of the Social Security Administration. At that time, people’s well-being was finally put first.
“Among our objectives I place the security of the men, women and children of the Nation first.”
Franklin Delano Roosevelt – June 8, 1934 [1]
The premise of the Social Security System is straightforward: create a Social Security Trust (the Trust) funded by payroll contributions, split between employees and employers, to provide for people during retirement. It was not intended to be a mechanism for getting rich. It was to ensure people could retire without the threat of poverty.
In 1977, the US implemented an automatic increase in the salary cap to which Social Security taxes, or FICA, would apply. [2] In 1983, the Greenspan Commission reworked the SS system to ensure the trust could remain healthy. [3] The basic underpinnings of the plan were:
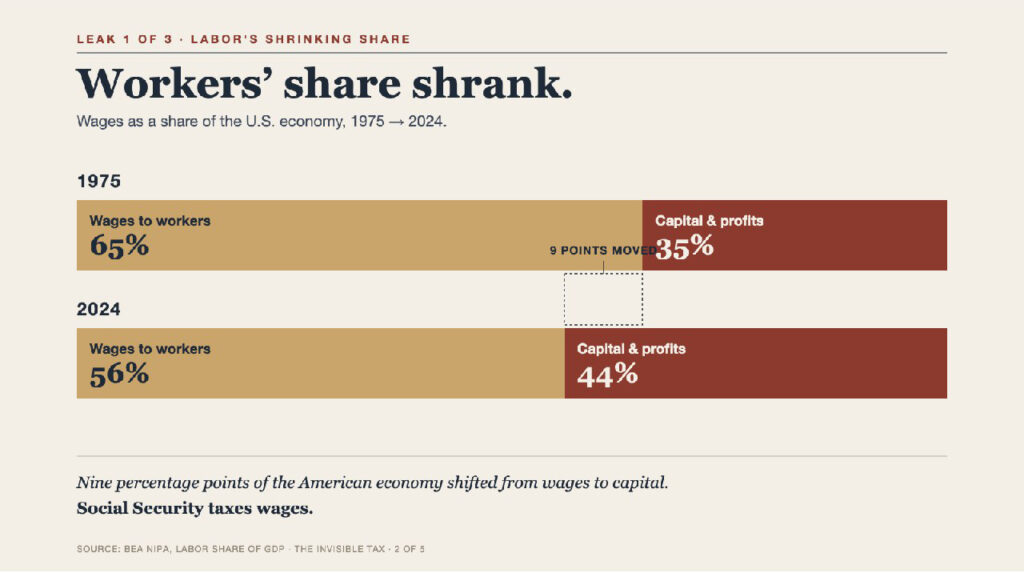
The wage pool remains about 65% of Gross Domestic Product (GDP) [4]
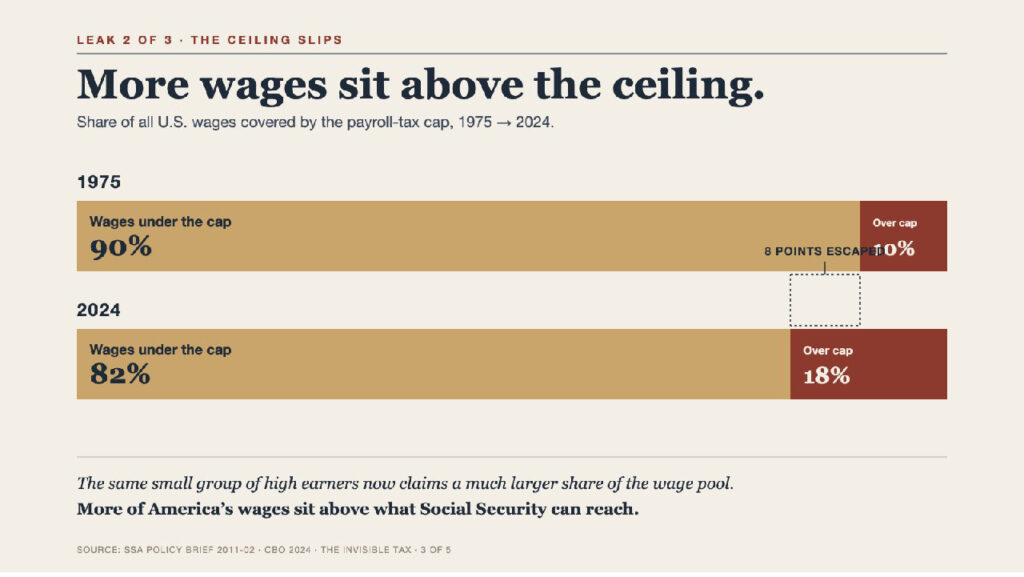
Social Security tax /FICA covers 90% of the wage pool [3]
Wage distribution remains steady, so the cap covers 90% ongoing [3]
At the time, roughly 6% of workers were paid wages that rose above the wage cap. [3]
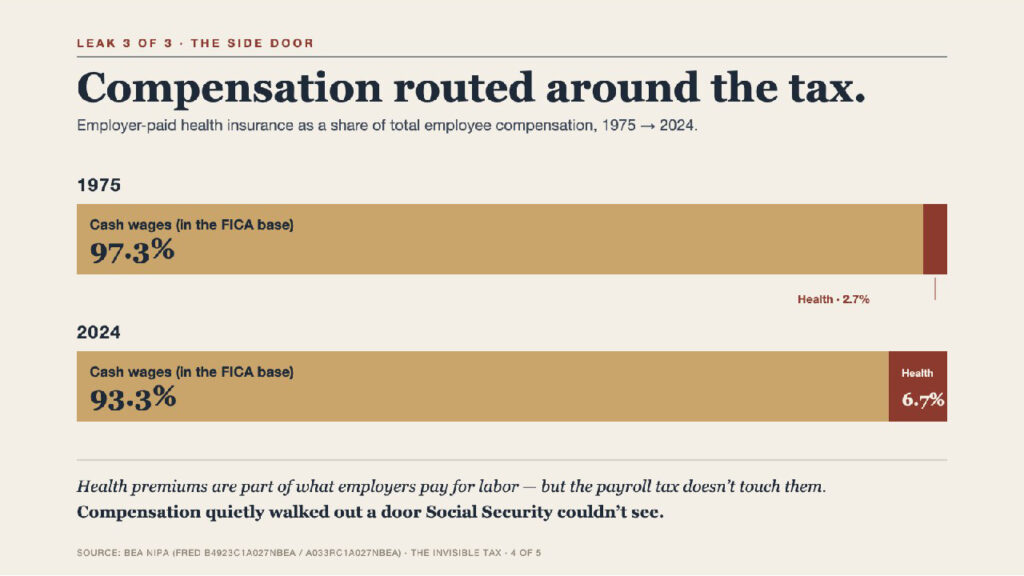
It is also important to note that health insurance benefits, which are part of the wage pool but not subject to FICA taxes, were about < 3% of the wage pool. [5]
Note on GDP: the GDP is the total value of goods and services produced within a country. Think of it as the country’s collective revenue or sales. The growth in GDP is a combination of increased productivity (i.e., workers produce $ 1,000 of goods per hour in one year, and then $1,050 the next; the productivity increase was 5%). There are components to productivity growth, but that’s the basic idea. The other component is inflation. That averages about 3.7% per year over 50 years. [6]
The Dismantling of our SSA Underpinnings
We are being told by Social Security Administration Commissioner Frank Bisignano and Centers for Medicare and Medicaid Services (CMS) Administrator Mehmet Oz, the current administration, as well as companies and many wealthy people, that the SS Trust Fund is running out of money because too many people are reaching retirement age. Their solutions are to tell us to work more years and accept fewer benefits. Their solutions ignore the underlying reasons the Trust is having trouble.
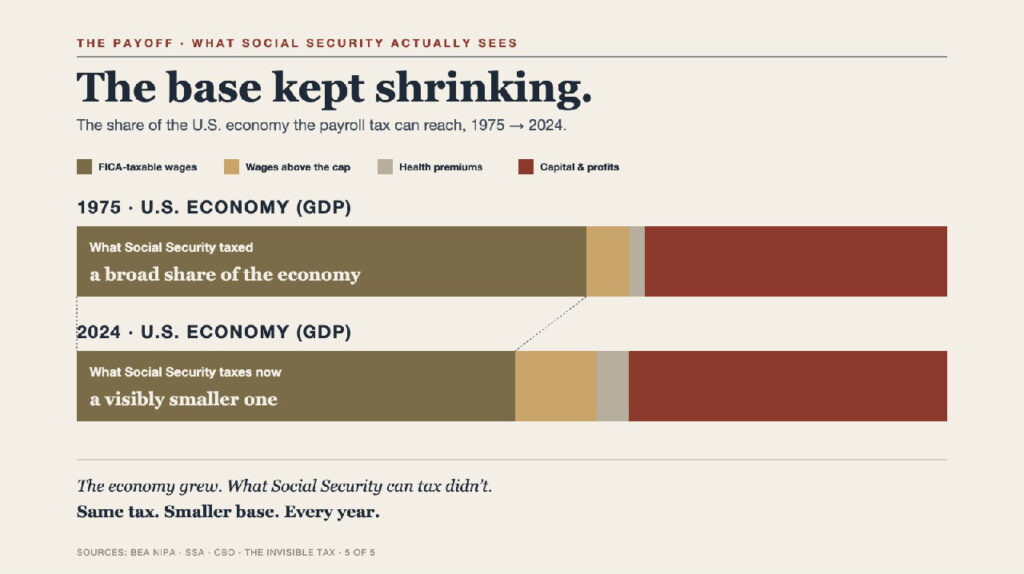
The primary factors in the erosion of trust involve the transfer of wealth from the workers in the wage pool to the wealthier people in the country. This isn’t a left-wing mantra. It’s math. It also has implications beyond SS.
The Proportional Decline of the Wage Pool
When the Greenspan Commission developed the new framework for keeping the Trust funded, a key assumption was that the Wage Pool would continue to be 65%-68% of the GDP. In other words, the share of the country’s income split between companies and workers would follow its historical pattern. That did not happen.
Wage Pool Declined 14% Relative to GDP
1975, it was 65% of GDP. [4]
2026, it was 56% of GDP. [4]
As workers became more productive and the GDP grew, companies increased profits at a much faster rate than wages. By 2024, the Wage Pool was down to 56% of GDP. [4]
More of Wage Pool Consumed by Higher Earners
The Commission’s projections assumed the Wage Pool split would remain stable, allowing automatic caps to maintain 90% coverage of wages. That did not happen.
Social Security Tax Cap Coverage Drops 8.8%
1983, it covered 90% of wages [3]
2024, it covered 82% of wages [3]
By 2024, the FICA wage cap coverage fell to 82%. [3] This happened because higher-income earners saw their wages increase at a faster rate than those of the general working population. We did not see a proportional increase in the number of workers who were raised above the cap.
In 1983, 6% of workers had salaries above the pay cap. In 2024, that percentage was the same. [3] 6% have wages above the cap, and 94% have wages below the cap. The FICA coverage dropped from 90% to 82% because wages were disproportionately funneled to high-income employees.
This had a material impact on the Trust. If a worker earns $50,000 a year and receives a 10% wage increase, the full $5,000 increase is subject to FICA taxes and helps fund the Trust. If an employee earns $1,000,000 and receives a 10% wage increase, none of the $100,000 increase is taxed.
Because the wealthier got disproportionately wealthier, there was a very real negative impact on the Trust.
The Health Insurance Impact
Unlike every other country, employer-sponsored health insurance is part of the US wage pool. But since the insurance premiums are excluded from FICA, money spent on health insurance does not contribute to the Trust. Over the past 50 years, this has negatively impacted the Trust balance.
A relative 100%+ Growth in Health Insurance
In 1975, untaxed Premiums were <3% of the Wage Pool [5]
In 2024, untaxed Premiums were ~7% of the Wage Pool [5]
Health insurance premiums in 1975 accounted for less than 3% of the wage pool. [5] The cost of health care rose faster than the GDP (of which it is a part). As a result, health insurance premiums accounted for about 7% of the Wage Pool in 2024. [5] That is an additional 4% of the Wage Pool no longer contributing to the Trust.
The Trust Could Be Fully Funded & FICA Tax Lower
The Trust funding deficit is about $41B per year. [7] There are several ways to view the three key factors and to address their impact on the Trust funding deficit.
If our experience had matched all the assumptions of the Greenspan Commission, the Trust would be flush. I’ll show the math for these, but here is what was planned that didn’t happen.
If:
The wage pool had kept pace with GDP, FICA tax revenue would be + $190B/year; [8]
The tax cap covered 90% of wages, FICA tax revenue would be + $115B/year; [8]
The Health Care Ins was still 2.7%, FICA tax revenue would be + $50B/year. [8]
If all three remained in the same ratios as 1983, the combined impact would be +$387B / year. [8]
How Much GDP would have to stay in wages to fund the Trust?
With Health Insurance Premiums held at 7% of the Wage Pool and the tax cap still covering only 82%, the Wage Pool’s share of GD would need to be only 58% vs the current 56%. [8]
This would bring the labor from $16.2T to $16.8T, generating an additional $42B to fully fund the Trust.
So, instead of cutting labor share from 65% of GDP down to 56%, if it were 58%, our SS Trust would be fully funded.
Mechanisms Behind the Shift
I am not going too deep into the elements that encouraged the shift. Part of it is the cultural acceptance of the wealthy’s edict and changes to the legal standing of companies and organizations per rulings of the Supreme Court in the 1970’s.
SCOTUS 1976 ruling: Money equals speech – opened the path to unlimited political spending. [9]
SCOTUS 1978 ruling: Corporations have the same speech rights as individuals. [10]
Top marginal tax rate cut from 91% (1960) to 28% (1986), now 37% [11]
Union membership collapsed from 35% to < 10% [12]
Financialization: stock market became the dominant wealth engine
Globalization compressed middle-class wages
The first two points opened the door for corporations, organizations, and very wealthy individuals to influence politicians and legislation in ways average individuals cannot. The changes we’ve seen over the last 50 years have been much more favorable for the upper class and large companies. This is a direct result of their influence on our representatives.
Flexibility for Funding the Social Security Trust
While I looked at GDP as a source of funding for the Trust, the fact is there is plenty of money in the economy to fund the Social Security program. It’s a question of the willingness of those with power and wealth to do so. The fact is, the SS Trust could be easily funded with a $29T GDP. [13] We are talking about $41B.
When the upper class tells you that you are the problem because you don’t work enough, don’t accept it. They are the problem. They made these decisions, diverted GDP, increased their wages, and detracted from the Trust.
Sources
[1] Franklin D. Roosevelt Presidential Library. Franklin D. Roosevelt, message to Congress on the objectives and accomplishments of the administration, June 8, 1934. Franklin D. Roosevelt Presidential Library & Museum. https://www.fdrlibrary.org/documents
[2] SSA, Legislative History of Social Security. Social Security Administration. “Automatic Increases in the Contribution and Benefit Base — Legislative History.” 1972 Social Security Amendments introduced automatic annual indexing of the taxable earnings base, first applied in 1975. https://www.ssa.gov/oact/cola/AWI.html
[3] SSA Policy Brief 2011-02 (Whitman & Shoffner). Social Security Administration. Policy Brief No. 2011-02, “The Evolution of Social Security’s Taxable Maximum,” September 2011. Source for the 1983 Greenspan Commission target of 90% covered-earnings coverage, the drift to ~82% today, the persistence of ~6% of workers earning above the cap, and the cap-to-average-wage-ratio history. https://www.ssa.gov/policy/docs/policybriefs/pb2011-02.html
[5] BEA NIPA via FRED (health insurance share of compensation). Bureau of Economic Analysis, National Income and Product Accounts. FRED series B4923C1A027NBEA (Employer Contributions for Group Health Insurance) as a share of A033RC1A027NBEA (Compensation of Employees). Health share of compensation: 2.7% in 1975; 6.7% in 2024. https://fred.stlouisfed.org/series/B4923C1A027NBEA
[6] BLS CPI-U, 50-year average inflation. Bureau of Labor Statistics, Consumer Price Index for All Urban Consumers (CPI-U). Compound annual inflation rate from 1975 through 2024 is approximately 3.8% per year. https://www.bls.gov/cpi/
[7] 2024 OASDI Trustees Report. Social Security & Medicare Boards of Trustees, 2024 Annual Report of the OASDI Trustees. The Trust ran a cash-flow deficit of approximately $41 billion in 2023; the trust fund is projected to be depleted in 2034. https://www.ssa.gov/oact/tr/2024/
[8] Section VI math worksheet (2026-07-03). Author’s calculation. Each counterfactual holds all other channels at current values and rolls a single factor back to its 1975/1983 pattern; results are calibrated so the reconstructed 2024 baseline matches actual OASDI payroll-tax receipts (~$1.18T per the 2024 Trustees Report). Underlying inputs from BEA NIPA, SSA Policy Brief 2011-02, and the 2024 Trustees Report.
[9] Buckley v. Valeo (1976). Buckley v. Valeo, 424 U.S. 1 (1976). The Supreme Court struck down mandatory limits on independent political expenditures on First Amendment grounds, establishing the money-as-speech doctrine that opened the way to later expansions such as Citizens United (2010). https://www.oyez.org/cases/1975/75-436
[10] First National Bank of Boston v. Bellotti (1978). First National Bank of Boston v. Bellotti, 435 U.S. 765 (1978). The Supreme Court held that corporations have First Amendment speech rights in the context of political spending on ballot initiatives, extending the free-speech protections of natural persons to corporate entities. https://www.oyez.org/cases/1977/76-1172
[12] BLS union membership series. Bureau of Labor Statistics, “Union Members Summary,” annual releases; historical series compiled by unionstats.com (Hirsch & Macpherson). Combined public+private union density peaked near 34.8% in 1954 and had fallen to ~10.0% by 2023. https://www.bls.gov/news.release/union2.nr0.htm
[13] BEA GDP (2024). Bureau of Economic Analysis, National Income and Product Accounts, Table 1.1.5. Nominal U.S. GDP in 2024 was approximately $29.0 trillion. https://www.bea.gov/data/gdp/gross-domestic-product
The body cam footage from the ICE agent doesn’t change the underlying issue in this shooting.
As I mentioned in the original post, this may be intentional or it may be because of bad training.
The character of the person shot, Good, is not the issue. When I voiced concern about the shooting, it was not because of some “left” narrative that she is such an upstanding person.
As I try to do but sometimes fail, I focus on what happened, not necessarily to whom it happened.
I mentioned training in the original post for a reason. Law enforcement is hard as hell. I could never do it. Aside from the everyday difficulty, dealing in life and death situations is beyond my character to handle. Among other things, good cops are a mix of integrity, fortitude, and training.
Training is what allows a good cop the best chance to act in a way that aligns with their integrity. In tense situations, the best intention will fall apart without it.
As for Minneapolis, I am going to approach this from the video/tactical perspective first and then touch on my philosophy about governments.
First Video
What I saw in the first video was the officer approaching the car from the front passenger side, crossing over to the front driver’s side of the car. The driver backed up, the front wheels turned to the right (away from the officers) and then started to proceed. As this happened, the officer on the front driver’s side drew his sidearm and fired as the car moved.
Second Video
In the second video, I saw(from the officer’s perspective) the officer in a verbal exchange with the passenger(this was not apparent on the first video). The passenger got into the car as it backed up and as the officer crossed over to the front driver’s side of the car. Then I saw the driver turn the steering wheel to the right, away from the officers and start to move forward and contact the officer with the driver’s fender – more a sound than a visual – (“clipped” the office is how I’ve heard it described), at which point the officer’s camera dropped.
There are two things that jump out at me about this situation.
First:
There are various considerations around when there is a use of force, and why that situation arose.
As late as 2025, SCOTUS has ruled that the immediate situation alone (car moving toward an officer) cannot be the only determinant in whether deadly force is allowable, what is called the ‘moment-of-threat” rule cannot be applied. Rather the totality of the situation must be considered.
One of the factors the courts look at in totality is if the officer using deadly force created or significantly contributed to the situation that posed the threat. “Officer-created-jeapardy” does not justify use of deadly force.
This is one of the reasons I mentioned training.
There are a lot of training sources for law enforcement. But, common among them, and in particular at the federal level, are tactics around safety and de-escalation. Among these: Don’t place yourself in front of a vehicle (this is “officer-created-jeapardy”); if possible, step out of the way of a moving vehicle (de-escalation); don’t fire at a moving vehicle (there are cases in which the vehicle posed a threat to the public, thus allowing force).
Assessing and reacting to a situation like this, for the average person, is nearly impossible. But, officers aren’t supposed to be average. Their training is supposed to make them far better than average.
You may not like the rules around use of force, but they are there, and until changed, we should expect them to be followed.
Second:
The timing of the firing was after the officer was “clipped” and while the driver was trying to flee. He wasn’t firing to prevent contact. There was no threat of additional contact.
We can disagree about the intention of the driver; but the timing of the shots was after the contact and while the vehicle was moving away.
Based on both videos, I will contend that the contact was unintentional, and was clearly not life-threatening. But, with adrenalin and literally no time to assess, an officer in the moment may not be able to realize that. This is why training is so important.
My perspective on Government.
The government and its agents hold all the power.
We have a Constitution that is supposed to provide guardrails in the use of that power. The Constitution guides the making of our laws by Congress, and the courts assess if those laws and the implementation of those laws, abide by it and the amendments to it. The Executive branch implements the laws and is the only branch that has the capacity to “take action,” or have a direct impact on the citizens through its various agencies.
For 250 years, we have operated on the honor system. If the leaders in government decide not to abide by the rules, there is little the citizens can do about it. When Congress passes a law, or the courts make a ruling, the Executive branch is supposed to abide by these. But there is no mechanism to ensure that it does. Up to now (for the most part and with a few exceptions), administrations have honored this approach.
Over the past year, the administration has openly defied the laws passed by Congress and the rulings of the courts. I have posted on this ad nauseum on FB, with specific examples of violation of court rulings and Constitutional amendments. The President openly states that his only limit is his own morality. From this perspective, the rule of law no longer exists.
So, when a situation like Minneapolis arises, we have to ask the question, “Is this a training issue, or is there a strategy behind these escalations?”
This is beyond me and my personal interest. I am old enough that I may not live long into the repercussions of this administration’s disregard for the rule of law. I do, however, seriously question if my descendants will live in a free America.
The theory behind capitalism and free markets is the better allocation of resources based on supply and demand. It can be rough and painful at times, but with proper guardrails, it has worked well for us.
The key to the social benefit of capitalism is that it is balanced with regulations. It is hard to argue, given our history, that unregulated capitalism is good for society. From horrid working conditions of the early 20th century, to mass poisoning and pollution through the mid to late 20th and continuing (Superfund Sites now), to the financial abuse (mortgage industry meltdown that took the global economy with it), and a host of other one-offs, there is no shortage of examples of unregulated or even illegal activity in unfettered capitalism to demonstrate the harm it can do.
Over the past couple of decades, a new threat to our societal good has emerged. In some sectors, it is a nuisance; in others, it is outright dangerous.
Private Equity companies can help businesses. They can provide an exit for owners, a consolidation option in a diminishing market, or a source of capital and expertise for quick growth for struggling companies. Generally, the PEs find undervalued private companies (or companies to bring private), resource them and then sell them with a relatively quick turnaround.
This is good for society… at least I think it is. But things have gone sideways.
The annoying part is when the PEs buy up many small private companies in a sector within a geography, then reduce service and increase prices. When the PEs do vertical integrations, they also force business through other companies in their portfolio that you would not work with otherwise.
We see this with veterinary services in our area. Prices are going up, and service has been much less. This is annoying and I’d rather not have to deal with it. But, if a Vet wants to sell their practice to a PE so they can retire, who am I to stop them?
Unfortunately, it does stop at just being annoying. It is getting abusive in physical, financial, and societal ways.
PEs have been abusing laws designed to manage risk and protect those who take it. They purchase a company, drain the cash, drive up debt, sell off valuable assets, and then declare bankruptcy, leaving suppliers, customers, and other stakeholders with receivables that will never be seen.
This isn’t a case of a bad strategy, poor execution, or a poorly run business. The strategy is perfectly sound, well executed, and has absolutely nothing to do with running a business well.
Private Equity:
The PE firms have every intention of taking on services without paying for them.
The PE firms have every intention of acquiring revenue for services with no intent to deliver.
The PE firms have every intention of maxing out lines of credit with no intention to repay.
In this strategy, the Private Equity firms add no value to the economy or society. Their goal is to extract, even steal is an appropriate verb, money with the sole purpose of funding their next theft for even greater returns.
In any industry, this abuse of the system should be illegal; it is fraud that has been legalized through the inaction of our legislators to regulate. At the very least, they should be excluded from bankruptcy protections.
One of the challenges is that, through the creation of legal entities, individuals responsible for this fraud are not culpable. You simply can not find a venue to go after them. So, while patients at nursing homes suffer real physical and emotional harm because of these PE strategies, there is no recourse.
There is an effort to prevent PE firms from continuing this financial abuse, which leads to real harm. This effort is focused on the healthcare industry. While the argument for consolidation is that it will create efficiency and reduce costs, the experience is the opposite. This is particularly true with PE companies.
We have a funny confusion in our country. People vote as if the President controls the economy. We hear candidates make promises to reopen the coal mines, keep family farms open, lower the price of gas, and on and on. While they have no control over these things, we vote as if they do.
A (mostly) Free Market Economy
We have a “free” economy. The government does not control it. At best, the Fed can implement monetary policies that mitigate the swings. But, in a free economy, the markets dictate the price of gas, the demand for coal (yes, government regs impact demand, but at a policy level, not a control level), and the struggles of family farms are exacerbated by corporate mega farming.
The US does have subsidies to help specific industries. There are farm subsidies, energy subsidies, and so on. These help individual businesses (usually big businesses). They do not control the economy.
In fact, these programs are an admission that the government doesn’t control the economy. If it did, subsidies would not be the primary mode of helping sectors; we’d simply redirect the economic efforts.
If a President could control the economy or significantly affect it through normal governmental operations, that would be Socialism.
We have a free market economy (mostly.) It swings, and as it does, people get hurt. To help, we have social programs.
Having Social programs to mitigate the pain of a free economy is not Socialism; it’s compassion.
The irony of our recent election
For many decades, regions of our country have been suffering. Textile workers, miners, farmers, and manufacturing have all been hit by globalization. Our government has done little to help them truly. In part because the real answers are complex.
Instead, we elected the Candidate who said, “I’ll fix it,” and “Only I can fix it.”
He can’t. For decades, we’ve heard this and nothing.
What makes it ironic is that one of the things the government can do is expand social programs to aid people in transition. It’s not a fast answer. It’s not easy. It’s not simple.
It would take multiple administrations of consistent policies (see how Germany managed the demise of its coal mining industry), people willing to accept the reality (rather than a hollow promise), and a country willing to help its citizens.
Why is it ironic? Because the same party that is elected to “solve” the problems is a champion of reducing social programs and demonizes them as “socialism.”
The only tool they could use is not (and should not be) available to do what they promise is Socialism. And yet they demonize social programs that they could use, incorrectly labeling them as Socialism.
We see people getting angry everywhere. From road rage to social media, to news channels, anger is everywhere.
Perhaps it’s because it takes no effort to be angry. We don’t have to think. So many others are angry, even egging us on the be angry too. It’s very easy to get angry.
Being angry takes no effort.
It does take a lot of our energy, though. It leaves us with little energy for anything else that actually requires effort.
The sad thing about anger is that it seems to provide its own jump start. We don’t need to have the energy to get angry. We can be dead tired, and still, some story manages to infuse us with the energy to start being angry all over again.
It really is like a drug.
And like a drug, anger can consume us. We need it to become energized. We seek it out.
How else can we explain the amount of time we spend watching cable “news” programs?
Cable “news” is like the crack den for anger junkies.
And like drug dealers, the networks know how to hook their users, getting them to come back for another fix.
Being happy requires effort, at first.
Like any new habit, you have to be intentional as you develop happiness.
The first step is perhaps the hardest. Stop engaging with the anger dealers. Turn off cable “news” and block peddlers of anger in social media (or just stop social media altogether.)
Next, find joy in the little things. Seek out music that makes you smile or just feel good. Talk to people who have positive energy. If the sun is out, face the sky and smile. Look for the flowers, or the art, or the laughing child. Find the things that make you smile, even just a little.
Once you start making a habit of looking, you’ll find all sorts of things that can make you smile.
Before long, you just smile more with no extra effort. You may even become the one who helps others to smile.
The habit starts with effort and soon becomes a part of you.
You have the control not to be angry. It just takes a bit of effort to start.
For years I’ve struggled with the western perspective that we are being judged or given a test by a divine being. A test where passing means heaven and failing means eternal damnation. A test for which we are (all) wholly unprepared.
Indeed, those who adhere to their religions will say that we are taught through the scripture. But, I hope these adherents understand that all of us who have not received the calling through divine inspiration are left wanting. Which scripture is “The Scripture”? Whose interpretation of “The Scripture” is correct (if, indeed, any scripture is correct)?
Imagine a math class taught by half a dozen teachers. Each has a degree in mathematics, though from a different university. And all of them give you different answers to “what is 2 + 2”?
2+2 = 6
2+2 = 25
2+2 = 99,323,233.324224225
2+2 = 33,333
2+2 = 432
2+2 = 948,499
All of these are wrong. But, that doesn’t stop some from proclaiming an answer of such ridiculous precious that only the most delusional among us would accept it.
While the correctness of a math problem is objectively provable, the desire or intent of a divine being is not (I’ll not dive into the question as to whether there is or is not a divine being.)
So, in the absence of absolute certainty in the desire of what God wants, I find it implausible that She would allow our ignorance to be so great as to render our chances of going to heaven or hell simply a matter of which religion we chose to follow, or even worse, to which we were exposed. In other words, She would not allow our entry to heaven to be a crapshoot.
The journey
The feeling that today’s western religions don’t have the answer is just one stop on a lifelong journey to understand why we are here. I wouldn’t aggrandize it to say finding the “meaning of life,” but to try to understand the great disparities in the lives I see. Why am I so privileged, and so many suffer so greatly (I don’t have a clue.)
The answer of “it’s all part of a grand plan” that is commingled with “God is a merciful and compassionate God” just rings hollow. An omnipotent being capable of absolute power and compassion simply wouldn’t allow such a random distribution of benefits.
Not that I don’t think this disparity is part of something bigger, but I don’t think it serves the purpose of a deity. I simply do not understand.
Jumping into the deep end
Sometimes, however frightening it may seem, the best way to learn is by doing, or in our case, living. If we keep our eyes and hearts open, we can see when our words or actions hurt or truly help others. We can learn if we are open to it.
But to learn, we must admit we don’t know everything and become comfortable with our ignorance. Ignorance is not a permanent state of being if you are aware and willing to learn.
Sometimes I feel like we swim in water too deep to touch the bottom. We can learn. We must learn. But as we do, it is scary.
It makes more sense that we are here in the process of learning to swim, not to swim or drown.
The Fallacy of “In the Name of”
What is fascinating is the institutional control over what it means to be a good ______(fill in your blank.) Across patriotism, fanaticism, religion, you name it, there is an organization of people telling you what it means to be a good _________, while insisting that it is a higher being whose ‘word’ they are sharing.
In the world of western religion, we find the interpreter’s role to be acutely controlling. After all, failure to accept their word as the “Word” will result in internal damnation.
Blindly following the dictates of some mortal authority in the name of a deity ensures that we remain in perpetual ignorance. So long as our actions align with their direction, all consequences can be justified, all responsibility removed.
Over millennia, we see unspeaking pain imposed on others being justified in the name of “saving soles” or the “greater good.” It is amazing how ferociously, in the name of the “Prince of Peace,” people have inflicted unimaginable violence and pain.
Today, “developed” nations continue to inflict pain in the name of a higher power. We justify discrimination, sexism, and racism, all of which impose pain on others. We justify it through a faulty interpretation of a faulty text people wrote over a thousand years ago.
Following institutions that wield authority “in the name of” is the surest way to shortcut rational considerations and to justify cruelty.
Where does this leave us?
Is your next word, or action, going to hurt someone now?
Forget everything else. Just answer the question.
Is shunning someone because they are gay going to help them or hurt them?
Is alienating a teenager, struggling with all the normal teenage angst compounded by gender identity questions going to hurt them?
Is your vision of the afterlife so certain that you can justify inflicting pain on someone who does not share your visions or who really needs help?
I don’t know what will happen tomorrow. I certainly don’t know what the afterlife holds. But, I do know that, here, now, we have the power to help someone or hurt them.